Hello,
I know that a lot of companies use Ekahau as preferred tool for Site Surveys, Simulation and Validation. The last years I do a lot of troubleshooting. During this I check the original Site Survey documentation and realize how many companies use the default template!
I also see people doing a one day site survey and need 1-2 days for documentation. For 3-5 days they need 2-3 days documentation, copy & paste images from the default report to the customize report…
This is the reason why I choose the customer report feature from Ekahau for my first blog post. I hope it’ll help some people to stop wasting time!
Tempalte requirements
At the begin, we need to think about our template. What information we’ll show the customer?
- Requirements?
- Signal strength?
- SNR?
As a first step this can be a good start for our template.
Create the template
We know what we’ll show in our template. Let’s start to create this template.
Requirements Tag
First we need our requirements, this are just text information, Ekahau call it “Data Tags”. Instead of using a specific requirement, we use the requirement’s you selected in Ekahau at the time the report is created. Alternated you can select a specific requirement by name. We will visualize just signal strength and SNR, let’s show those requirements:
<#${req-value-snr}#>
Now we generate a report and select “Template Report…”, select the template and a output folder. The Word file will now show you the selected values for signal strength and SNR.

But it show just those values and nothing more. Let’s change the template a little bit:
SNR: <#${req-value-snr}#> dB
Looks better?

Visualization Tag
As second step we’ll create our visualization for signal strength and SNR. We’ll begin with the signal strength:
We create a heat map visualization and select signal strength as type. Here is our result:

But what signal strength is it, 2.4 GHz or 5 GHz? Is it for my access points or for all access points? Different to the requirements it show you the default that is set by Ekahau: Report Template – Visualization Tags
It show you the signal strength for all access points on any band! Let’s change it to our access points on the 5 GHz band. Because the code get more complex, I write it in more lines.
“heatmap”:{
“type”:”sig-strength”,
“filter”:{
“include”:{
“owner”:”my”,
“band”:”5″
}}}}#>
Now we see the 5 GHz signal strength for our own access points.

As last step, we customize the heat map a little bit. Let’s show the access points, but filter it again for our own 5 GHz band and show the name. Additional we create the legend to know the colors.
“heatmap”:{
“type”: “sig-strength”,
“filter”: {
“include”: {
“owner”: “my”,
“band”: “5”
}}},
“aps”:{
“show-name”: “true”
,“filter”: {
“include”: {
“owner”: “my”,
“band”: “5”
}}}}#>
<#”visualization-legend”:{}#>
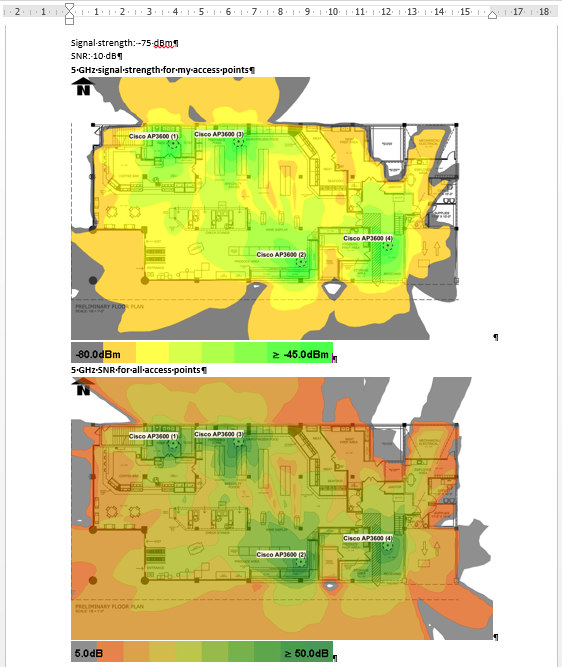
Let’s take a look to our result:

Now we can do the same for the SNR. For a better overview I change the code back from more line to one line. One change I do for the SNR, I don’t show it for my access points, I’ll show it for all access points!
SNR: <#${req-value-snr}#> dB
5 GHz signal strength for my access points
<#”visualization”:{“heatmap”:{“type”: “sig-strength”,“filter”: {“include”: {“owner”: “my”, “band”: “5”}}},“aps”:{“show-name”: “true”,“filter”: {“include”: {“owner”: “my”, “band”: “5”}}}}#>
<#”visualization-legend”: {}#>
5 GHz SNR for all access points
<#”visualization”:{“heatmap”:{“type”:“snr”,“filter”:{“include”:{“owner”:“my”,“band”:“5”}}},“aps”:{“show-name”:“true”,“filter”:{“include”:{“owner”:“my”,“band”:“5”}}}}#> <#”visualization-legend”:{}#>
Our final file looks like this:

And here the code, you can see, it doesn’t matter if you write it in one or more line’s:

This was a overview of the customer report function from Ekahau. But it’s just a start, what can we do more?
- Show walls for simulation
- Show notes for mounting
- Create views from single access points
- Create a list of all access points
There are a lot more functions as I show you. This post gives you just a short touch on the function. Look the user guide to get more information. And do create some templates on your own. Just think about, what you need and create a template for this. I’m personal have create a lot of different templates. Always create for the requirements I have, maybe languages, customer or tasks.
If you have questions, feel to create a command or ask via Twitter. Hopefully I’ll find some more time in the next weeks and create a second post with some more details about the report function.
Additional information you can finde in the user guide: Report Templates
Update: Second post is online, loops and APs.

[…] http://wifi-blog.com/en/2016/02/04/ekahau-report-template/ […]
[…] Ekahau Customer Report Template – Let’s start […]