Let’s start with the second part of my Ekahau Customer Report Template tutorial.
We know already from the first post, how to create heat maps and show the requirements. As you maybe already notice, the heat map is generated for one floor. If you have more than one floor, you need a loop or just the first floor is shown.
You can generate loops of different kinds. As first loop we’ll use the “floors” loop.
Here is our last code:
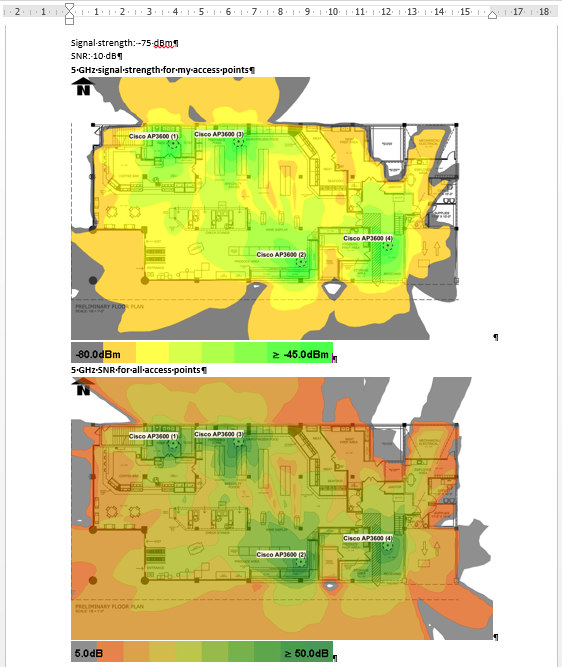
SNR: <#${req-value-snr}#> dB
5 GHz signal strength for my access points
<#”visualization”:{“heatmap”:{“type”: “sig-strength”,“filter”: {“include”: {“owner”: “my”, “band”: “5”}}},“aps”:{“show-name”: “true”,“filter”: {“include”: {“owner”: “my”, “band”: “5”}}}}#>
<#”visualization-legend”: {}#>
<#”visualization”:{“heatmap”:{“type”:“snr”,“filter”:{“include”:{“owner”:“my”,“band”:“5”}}},“aps”:{“show-name”:“true”,“filter”:{“include”:{“owner”:“my”,“band”:“5”}}}}#>
<#”visualization-legend”:{}#>
The result you can see in this PDF file, v1.pdf.
Create a loop
This works fine with a one floor project. To use it with multiple floors we need a loop and show the floor name:
dBm SNR: <#${req-value-snr}#> dB
<#“loop-start”: {“type”: “floors”}#>
This loop will walk throw all floors and generate all heat maps on a per floor base. The result looks like:
Signal strength: XX dBm
SNR: XX dB
Floor: Floor 1
5 GHz signal strength for my access points
HEAT MAP Signal Strength 5GHz, my aps
5 GHz SNR for all access points
HEATMAP SNR 5GHz, all aps
Floor: Floor 2
5 GHz signal strength for my access points
HEATMAP Signal Strength 5GHz, my aps
5 GHz SNR for all access points
HEATMAP SNR 5GHz, all aps
…
I add the PDF file, Loop-v2.pdf.
You can also create two loops, if you’ll first show the signal strength of each floor and then show the SNR of each floor.
This loop will walk throw the heat map type and generate it per floor. The result looks like:
Signal strength: XX dBm
SNR: XX dB
Floor 1 – 5 GHz signal strength for my access points
HEATMAP Signal Strength 5GHz, my aps
Floor 2 – 5 GHz signal strength for my access points
HEATMAP Signal Strength 5GHz, my aps
…
Floor 1 – 5 GHz SNR for all access points
HEATMAP SNR 5GHz, all aps
Floor 2 – 5 GHz SNR for all access points
HEATMAP SNR 5GHz, all aps
…
I add the PDF file, Loop-v3.pdf.
Show AP information
Now we can create heat maps of different types for different floors. But it’s usually needed to create a list of my access points. For this, we’ll work again with a loop. But now the type is “aps”.
Do show you the easy way, I don’t use the created template with the heat maps. We’ll start with a new file.
This show you the names of all access points in your file.

We can now filter to show just our own access points.
Take a look to the second result, the “Not my AP” is missing:

The access point information’s are Data Tags. You can see the different values in the User Guide. You can also create a template for site survey and a second on for simulation. In the simulation template you can show the “tx power” and “antenna height” from the simulation.
All in one report
In the last step we’ll now merge all this information to one report. I’ll use the sample where I show all information per floor. We’ll now also include the AP loop inside of the floor loop. This will show the APs on a per floor base.
The final report you can see as PDF file, FINAL.pdf.
Summary – Ekahau Customer Report Template
I show you some functions of the Ekahau Customer Report Template. But there is a lot more you can do with. The best of all, you can combined almost every loop, filter and information. As I show you, we use the same loop for the AP name. But it show us different information, because we use it in the final version inside a floor loop.
And now some tips from me:
- Read the user manual, it shows you all information
- Begin with small templates (the only bad part of this report function, debugging is not so easy)
- Try different report templates
Also read the different details:
Loops
Data Tags
Visualization Tags
If you are looking for more information or have different questions, feel free to enter it as comment!
Follow me on twitter: dot11_de
[…] Ekahau Customer Report Template – Loops & APs […]
[…] Ekahau Customer Report Template – Loops & APs […]